Creating the Scorecard Product
Overview
Over the course of a quarter, organizations spent hundreds of hours tracking down OKRs and plugging them into powerpoint tables for executive review.
Why not create that where the data actually lives? We built a flexible reporting tool that allowed users to pull in OKRs, display the data they care about, format, markup & present in one go. The report could live on and be accessed on the fly.
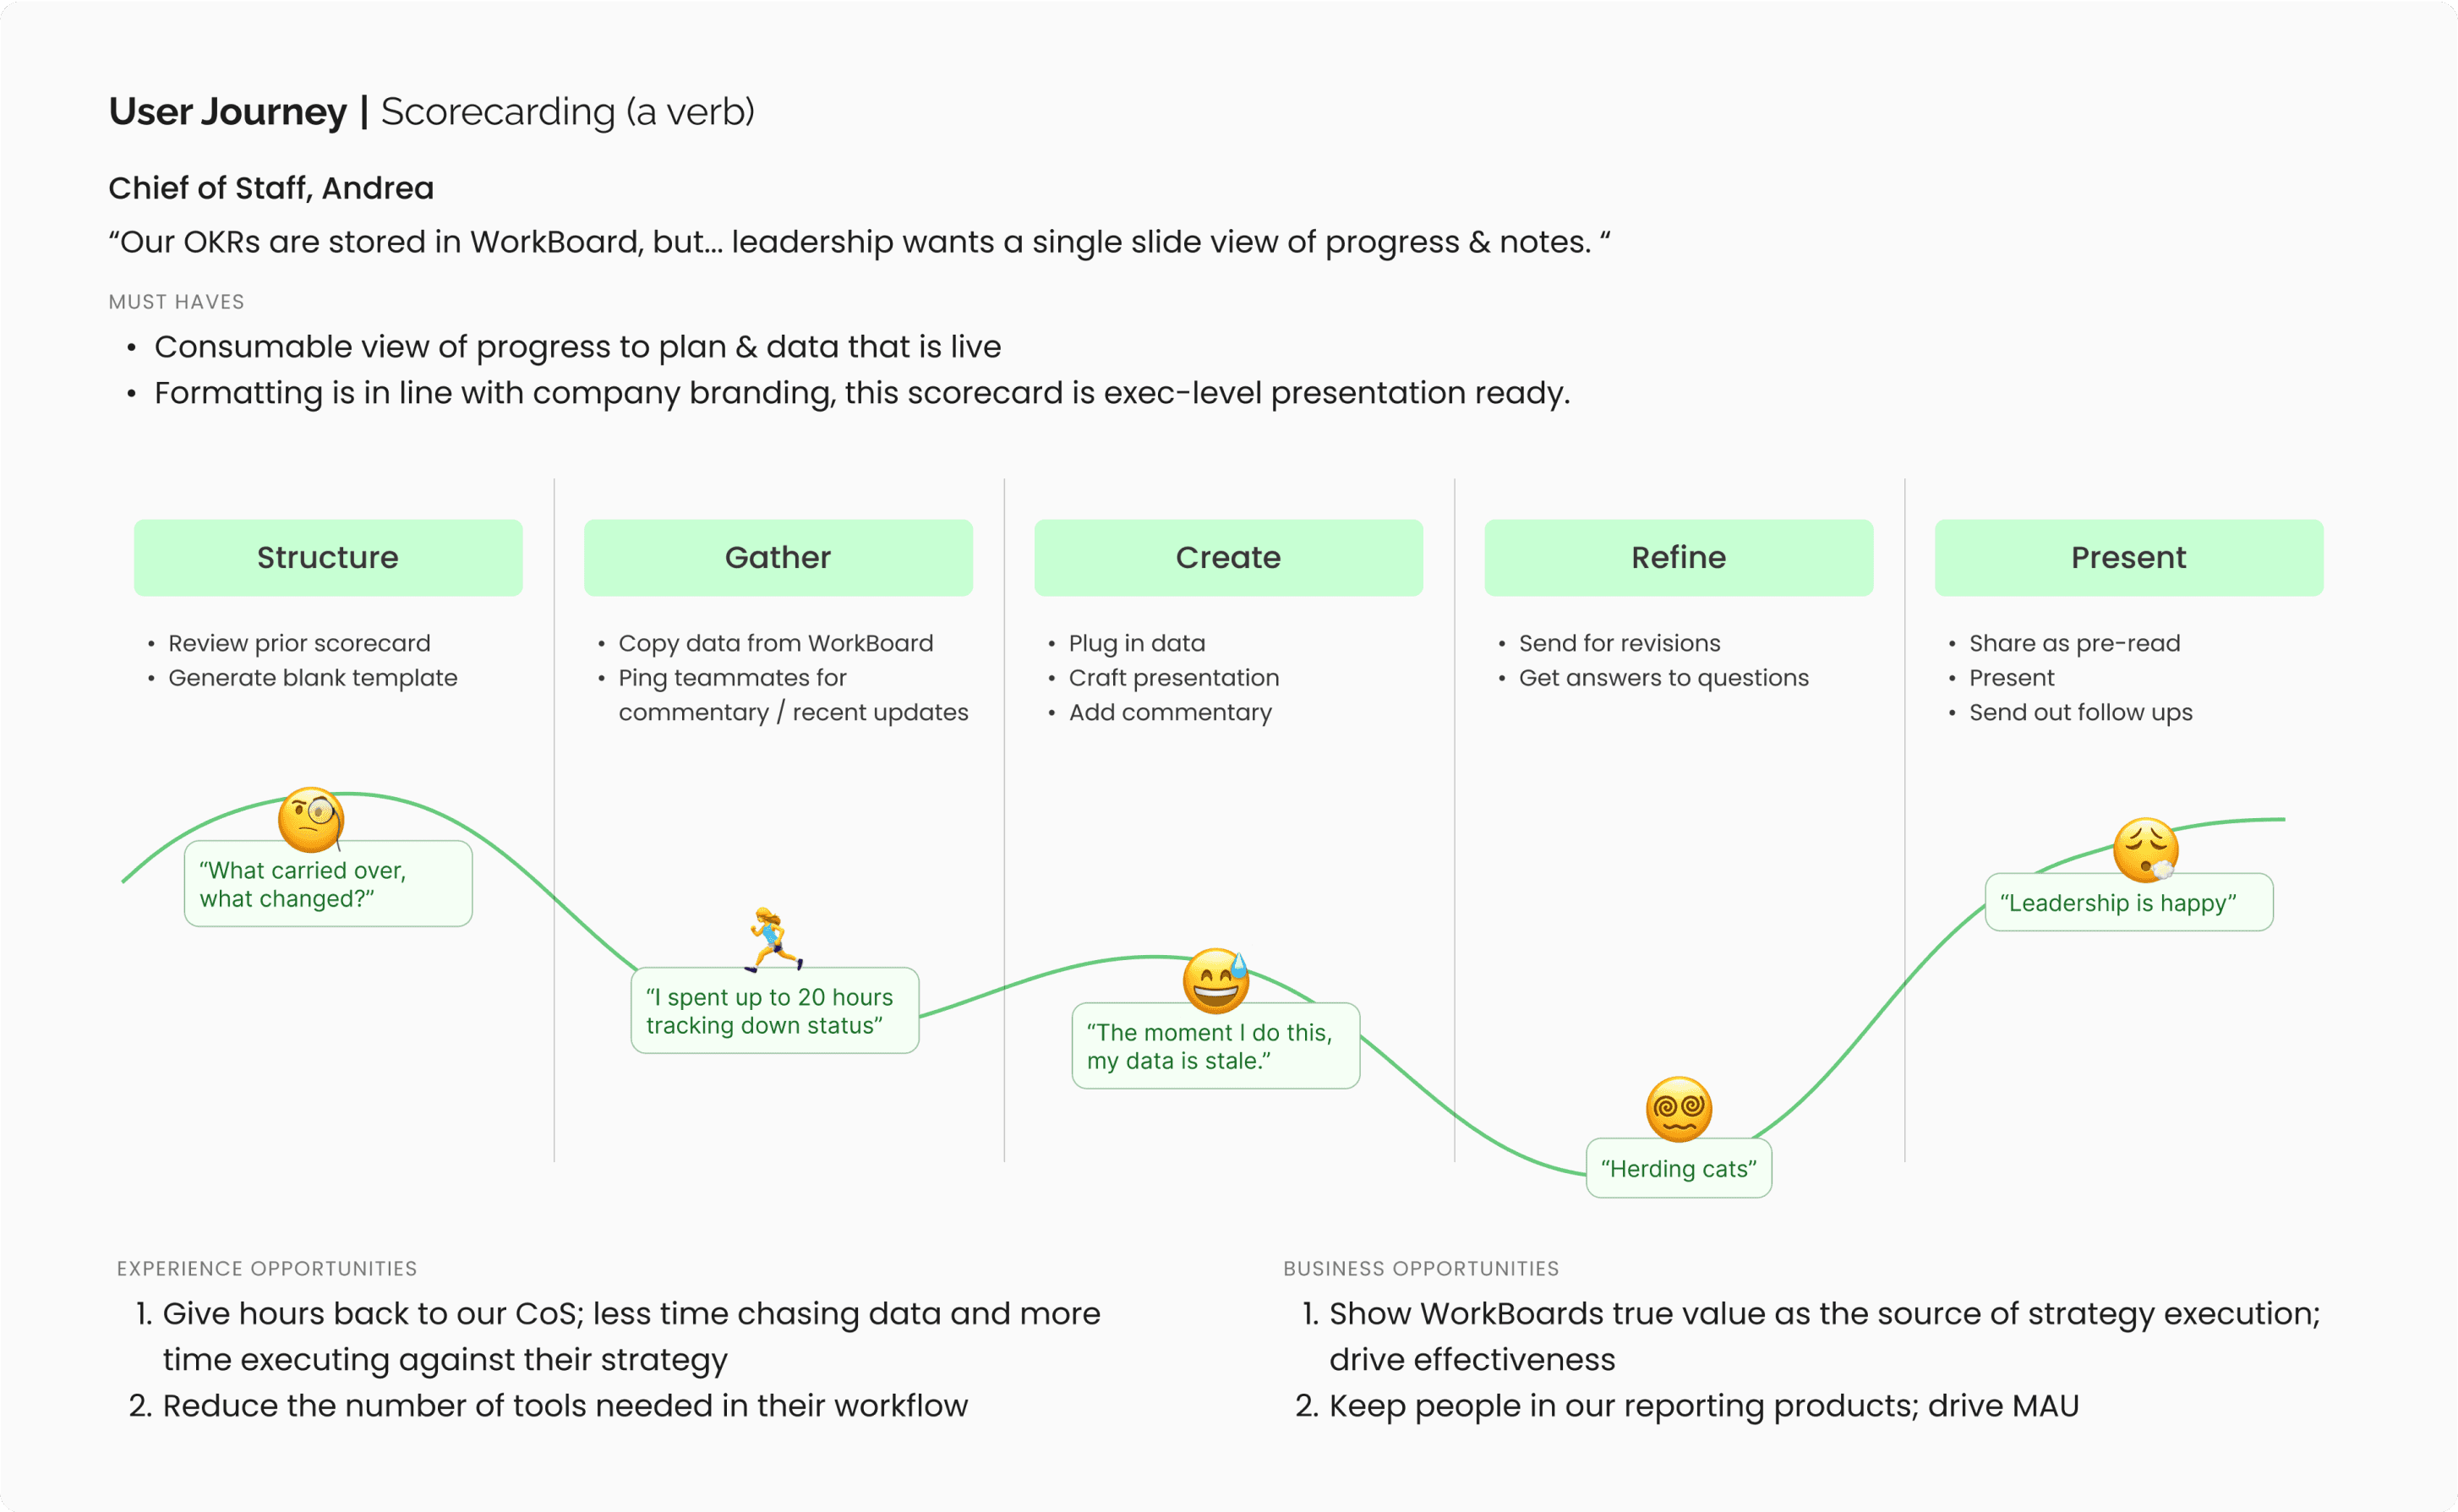
Understanding the need
Every organization had its own rhythm and style for checking in on & holding themselves accountable towards their OKRs. WorkBoard was an OKR & strategy tool trusted by fortune 500 companies to organize, track and showcase OKRs at every level. However - we heard a loud and clear need that reporting and "scorecard" generation is the key to accountability. Executives were yearning for a single page view with scannable statuses, owners and next steps. They relied on scorecards to drive their business.
While executives were our audience - the majority of the work to track down OKRs and produce a consumable report fell on the shoulders of directors, team leads, and chiefs of staffs.
Studying real scorecards
We pulled in our personas and did a round of generative research. Our customers were kind enough to give us real (and fully populated) scorecards they relied on to run their business. Patterns emerged quickly from customer scorecards; customers wanted to pull in OKRs, showcase the data that mattered to them, and mark it up for presentation. A sample scorecard is below, which is indicative of what we saw from many of our customers. These formed the basis of our requirements.

An emergent model
Studying customer scorecards was the most important thing we did, we continued to reference them each time we added functionality. Customer scorecards where data dense - upwards of 80 cells and colorfully marked up to convey meaning. We crafted product principles for a potential reporting tool - and began pitching to stakeholders.
Product Principles
Show only the data you care about
Format it your way
Embed & export with ease
Trust the data
You set the parameters, we'll populate the data
Iterate, test, iterate.
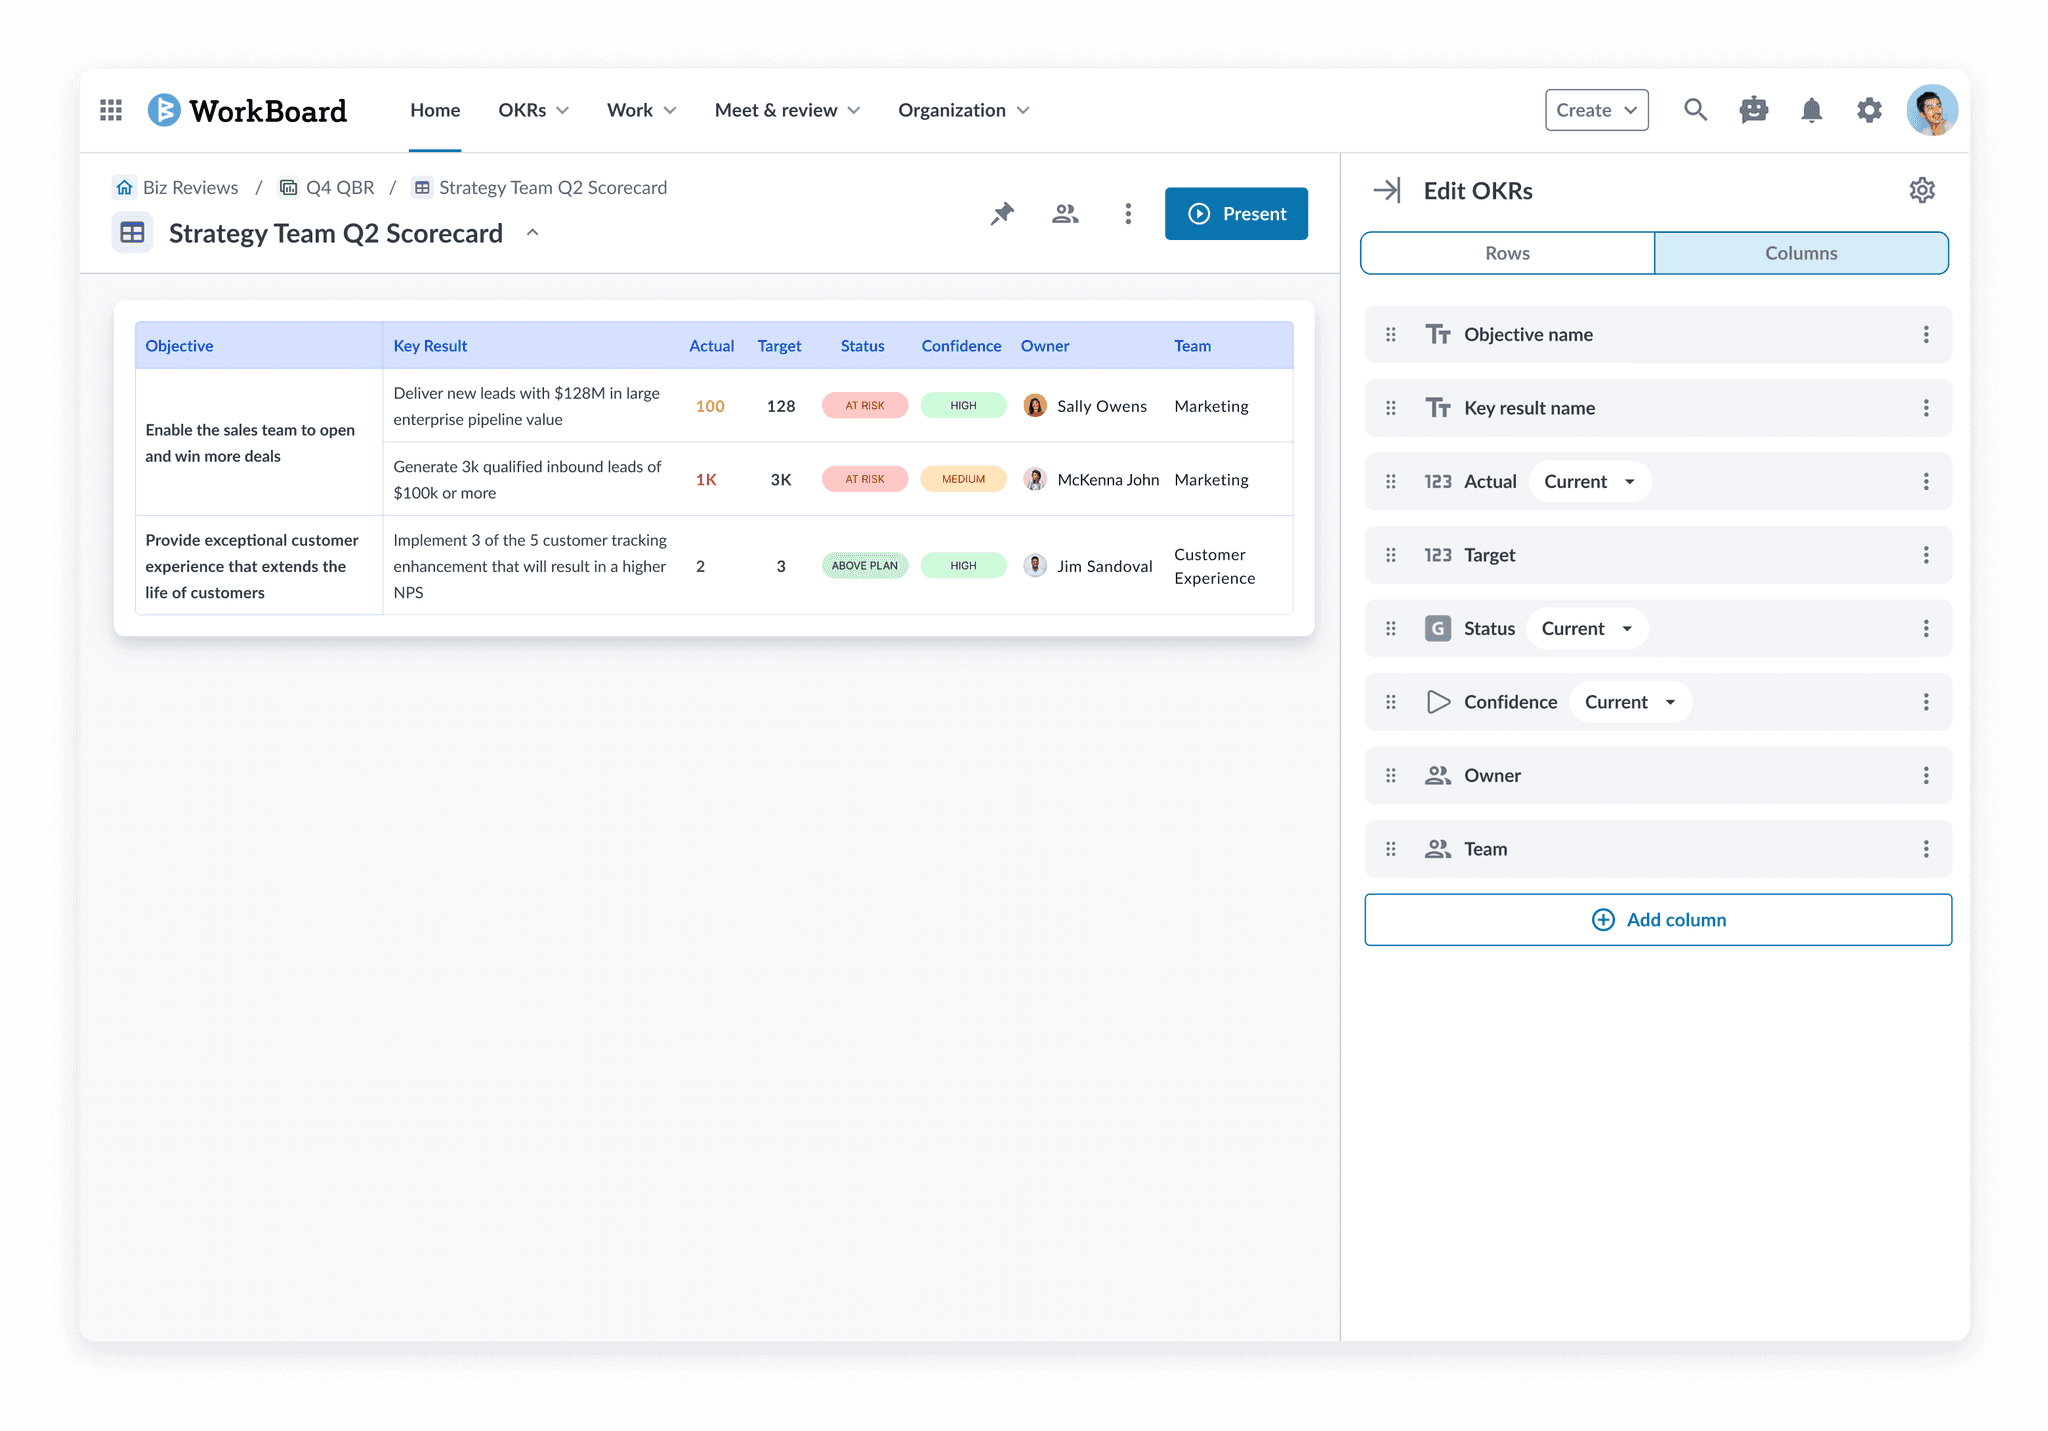
Skipping the ugly concepts - we landed on an elegant reporting building experience that allowed users to easily bring in OKRs and any of the attributes they wished. We played into the notion of rows & columns - your rows are determined by the OKRs you want to consume, and any attributes you wish to bring in will be displayed in columns. From there, format & customize your scorecard to your liking. Share and present there after.
We brought in customers early; showing them the concepts & model for adding OKR's and toggling attributes. Our colleague at SVB quoted "This just solved 95% of my use cases. This is incredible."

As you add OKRs, your scorecard begins to populate. Default column fields where defined in our generative research as the most common attributes users wanted to see.

Head to "columns" to configure your attributes. Pull in any OKR meta data that you wish.
Measures of Success
I left WorkBoard about 8 months after we launched Scorecards; but here's how we were tracking:
~6% (& climbing) platform MAU on Scorecards
87.5%: 1 Month MAU retention for all Users:
9 out of 10 Users that try Scorecards come back monthly!
Substantial customer love & buy-in; many reference orgs committing to Scorecards as the way they choose to run their business

Joel
Head of Strategy, VMWare
“We did a review on Core Team + Leadership Team. We go through it in 25 minutes and were able to drill down on specific KRs that were red or yellow and able to have meaningful conversation, and have necessary follow ups. It’s been proven to be really effective. Get through things fast without going down rabbit holes.”

John R
Business Performance Manager, AstraZeneca
“Scorecards have become invaluable to us.”

Lauren
Chief of staff, Optum Insights
"The scorecard view is so clean. It puts the most important information right there to drive the discussion."

Sarah W
Intel
“We spend so many manual hours pulling these numbers into powerpoint and the formatting them - with this we can do it all in a few minutes AND it comes to life”

Neil S
VP, Strategy & Business Operations, Data & Analytics at Thomson Reuters
“This is incredible. I have a monthly report in Excel that I use to show my leader progress. This will be able to replace that completely and save me loads of time for checking on status, updates, etc.”

Davo
Sixt
“We love Scorecards. We built it within 5 mins during the call. Sorting with the department owner, ability to add text narrative during each monthly meeting. Added some colors to the most important and risky KRs. So easy yet such a powerful feature."

Richard C
Business process owner, Jupiter
"Scorecards are a game changer. They are amazing. WorkBoard really did deliver something awesome."
Creating the Scorecard Product
Overview
Over the course of a quarter, organizations spent hundreds of hours tracking down OKRs and plugging them into powerpoint tables for executive review.
Why not create that where the data actually lives? We built a flexible reporting tool that allowed users to pull in OKRs, display the data they care about, format, markup & present in one go. The report could live on and be accessed on the fly.
Understanding the need
Understanding the need
Every organization had its own rhythm and style for checking in on & holding themselves accountable towards their OKRs. WorkBoard was an OKR & strategy tool trusted by fortune 500 companies to organize, track and showcase OKRs at every level. However - we heard a loud and clear need that reporting and "scorecard" generation is the key to accountability. Executives were yearning for a single page view with scannable statuses, owners and next steps. They relied on scorecards to drive their business.
Every organization had its own rhythm and style for checking in on & holding themselves accountable towards their OKRs. WorkBoard was an OKR & strategy tool trusted by fortune 500 companies to organize, track and showcase OKRs at every level. However - we heard a loud and clear need that reporting and "scorecard" generation is the key to accountability. Executives were yearning for a single page view with scannable statuses, owners and next steps. They relied on scorecards to drive their business.
While executives were our audience - the majority of the work to track down OKRs and produce a consumable report fell on the shoulders of directors, team leads, and chiefs of staffs.
While executives were our audience - the majority of the work to track down OKRs and produce a consumable report fell on the shoulders of directors, team leads, and chiefs of staffs.
Studying real scorecards
We pulled in our personas and did a round of generative research. Our customers were kind enough to give us real (and fully populated) scorecards they relied on to run their business. Patterns emerged quickly from customer scorecards; customers wanted to pull in OKRs, showcase the data that mattered to them, and mark it up for presentation. A sample scorecard is below, which is indicative of what we saw from many of our customers. These formed the basis of our requirements.
Product principles
Studying customer scorecards was the most important thing we did, we continued to reference them each time we added functionality. Customer scorecards where data dense - upwards of 80 cells and colorfully marked up to convey meaning. We crafted product principles for a potential reporting tool - and began pitching to stakeholders.
Show only the data you care about
Format it your way
Embed & export with ease
Trust the data
You set the parameters, we'll populate the data
Iterate, test, iterate.
Skipping the ugly concepts - we landed on an elegant reporting building experience that allowed users to easily bring in OKRs and any of the attributes they wished. We played into the notion of rows & columns - your rows are determined by the OKRs you want to consume, and any attributes you wish to bring in will be displayed in columns. From there, format & customize your scorecard to your liking. Share and present there after.
We brought in customers early; showing them the concepts & model for adding OKR's and toggling attributes. Our colleague at SVB quoted "This just solved 95% of my use cases. This is incredible."
As you add OKRs, your scorecard begins to populate. Default column fields where defined in our generative research as the most common attributes users wanted to see.
Head to "columns" to configure your attributes. Pull in any OKR meta data that you wish.
Measures of Success
I left WorkBoard about 8 months after we launched Scorecards; but here's how we were tracking:
~6% (& climbing) platform MAU on Scorecards
87.5%: 1 Month MAU retention for all Users:
9 out of 10 Users that try Scorecards come back monthly!
Substantial customer love & buy-in; many reference orgs committing to Scorecards as the way they choose to run their business
Joel
Head of Strategy, VMWare
“We did a review on Core Team + Leadership Team. We go through it in 25 minutes and were able to drill down on specific KRs that were red or yellow and able to have meaningful conversation, and have necessary follow ups. It’s been proven to be really effective. Get through things fast without going down rabbit holes.”
John R
Business Performance Manager, AstraZeneca
“Scorecards have become invaluable to us.”
Lauren
Chief of staff, Optum Insights
"The scorecard view is so clean. It puts the most important information right there to drive the discussion."
Sarah W
Intel
“We spend so many manual hours pulling these numbers into powerpoint and the formatting them - with this we can do it all in a few minutes AND it comes to life”
Neil S
VP, Strategy & Business Operations, Data & Analytics at Thomson Reuters
“This is incredible. I have a monthly report in Excel that I use to show my leader progress. This will be able to replace that completely and save me loads of time for checking on status, updates, etc.”
Davo
Sixt
“We love Scorecards. We built it within 5 mins during the call. Sorting with the department owner, ability to add text narrative during each monthly meeting. Added some colors to the most important and risky KRs. So easy yet such a powerful feature."
Richard C
Business process owner, Jupiter
"Scorecards are a game changer. They are amazing. WorkBoard really did deliver something awesome."